Welcome to the ultimate Step 1 Biostats Cheat Sheet, your indispensable companion for conquering the complexities of biostatistics. Dive into this comprehensive guide, where we’ll demystify statistical concepts, empower you with practical knowledge, and prepare you for success on your medical journey.
From understanding the fundamentals to interpreting complex data, this cheat sheet will equip you with the tools and insights you need to excel in your medical practice.
Key Concepts of Step 1 Biostatistics
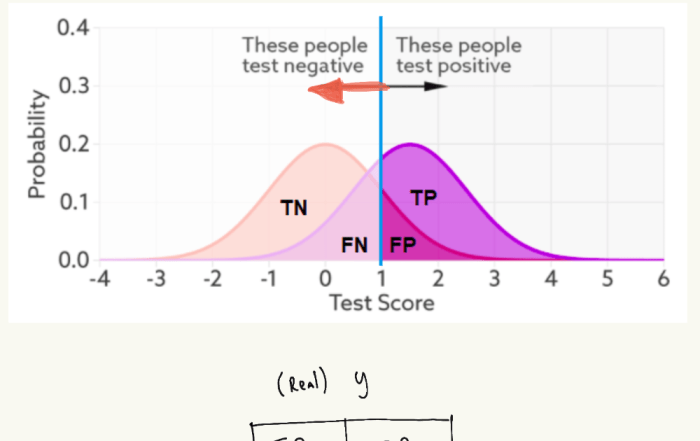
Understanding biostatistics is essential for medical practice as it provides the tools to interpret medical research, evaluate diagnostic tests, and make informed decisions based on data. Step 1 of the USMLE tests fundamental biostatistical concepts that are crucial for success in medical school and beyond.
Measures of Central Tendency
Measures of central tendency describe the “average” value of a dataset. They include:
- Mean:Sum of all values divided by the number of values.
- Median:Middle value when the data is arranged in order.
- Mode:Value that occurs most frequently.
Measures of Variability
Measures of variability describe how spread out the data is. They include:
- Range:Difference between the highest and lowest values.
- Variance:Average of the squared differences between each value and the mean.
- Standard deviation:Square root of the variance.
Hypothesis Testing
Hypothesis testing is a statistical method used to determine if there is a significant difference between two or more groups. It involves:
- Stating a null hypothesis (no difference).
- Calculating a p-value to determine the probability of obtaining the observed results if the null hypothesis is true.
- Rejecting the null hypothesis if the p-value is less than a predetermined significance level (usually 0.05).
Correlation and Regression
Correlation and regression analyze the relationship between two or more variables. Correlation measures the strength and direction of the relationship, while regression models the relationship using a mathematical equation.
Sample Size and Power
Sample size and power are important considerations in study design. Sample size refers to the number of participants needed to obtain meaningful results, while power refers to the probability of detecting a significant difference if it exists.
Descriptive Statistics
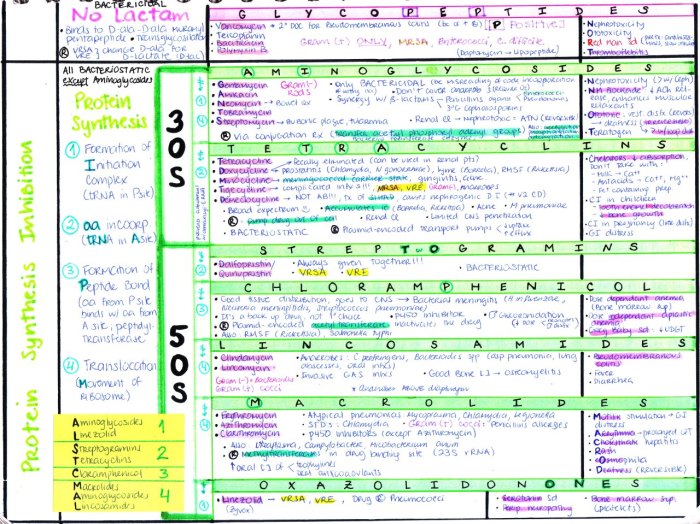
Descriptive statistics provide a concise summary of data, making it easier to understand and interpret. They help researchers and practitioners gain insights into the characteristics and patterns of their data.
Measures of Central Tendency
Measures of central tendency represent the “typical” value in a dataset. They include:
- Mean:The average of all values in the dataset.
- Median:The middle value when the dataset is arranged in ascending order.
- Mode:The value that occurs most frequently in the dataset.
Measures of Variability
Measures of variability describe how spread out the data is. They include:
- Range:The difference between the highest and lowest values in the dataset.
- Standard deviation:A measure of how much the data values vary from the mean.
- Variance:The square of the standard deviation.
Measures of Distribution
Measures of distribution describe the shape of the data distribution. They include:
- Skewness:A measure of how asymmetrical the distribution is.
- Kurtosis:A measure of how peaked or flat the distribution is.
Examples of Use
Descriptive statistics are widely used in medical research and practice, such as:
- Calculating the average blood pressure of a patient population.
- Determining the range of hemoglobin levels in a group of patients.
- Assessing the distribution of cancer cases by age and gender.
Inferential Statistics
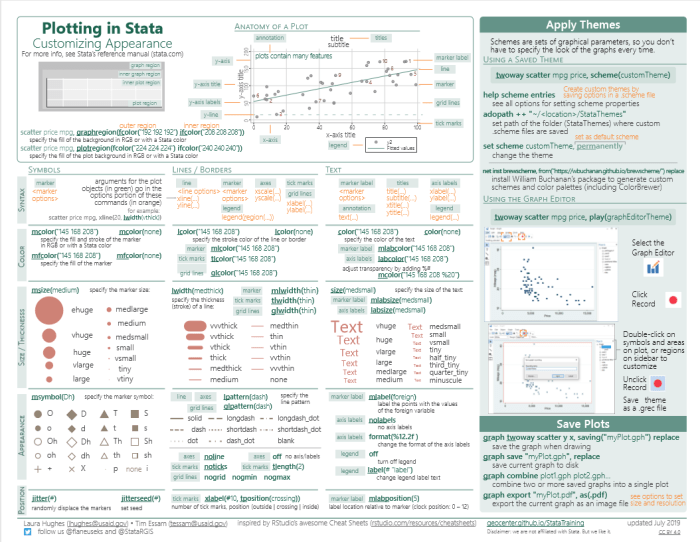
Inferential statistics allows us to make inferences about a larger population based on a smaller sample. It helps us test hypotheses, estimate population parameters, and determine the significance of our findings.
Hypothesis Testing
Hypothesis testing involves comparing a null hypothesis (H0) with an alternative hypothesis (Ha). The null hypothesis assumes no difference or effect, while the alternative hypothesis proposes a difference or effect. We collect data and calculate a test statistic to determine if the results are statistically significant, meaning they are unlikely to have occurred by chance alone.
Step 1 biostats cheat sheet is a handy tool for beginners in biostatistics. The cheat sheet covers basic concepts such as probability, hypothesis testing, and confidence intervals. If you’re looking for a fun way to show off your newfound knowledge, check out the omega psi phi dog collar . This stylish accessory is sure to turn heads at your next frat party.
And if anyone asks, you can proudly tell them that you learned about it from your step 1 biostats cheat sheet.
Confidence Intervals
Confidence intervals provide a range of values within which we are confident the true population parameter lies. They are calculated using the sample mean and standard deviation, along with a margin of error. The wider the confidence interval, the less precise our estimate.
P-Values
P-values represent the probability of obtaining a test statistic as extreme as or more extreme than the one observed, assuming the null hypothesis is true. A small p-value (typically less than 0.05) indicates that the results are unlikely to have occurred by chance and that we can reject the null hypothesis in favor of the alternative hypothesis.
Study Design and Analysis: Step 1 Biostats Cheat Sheet
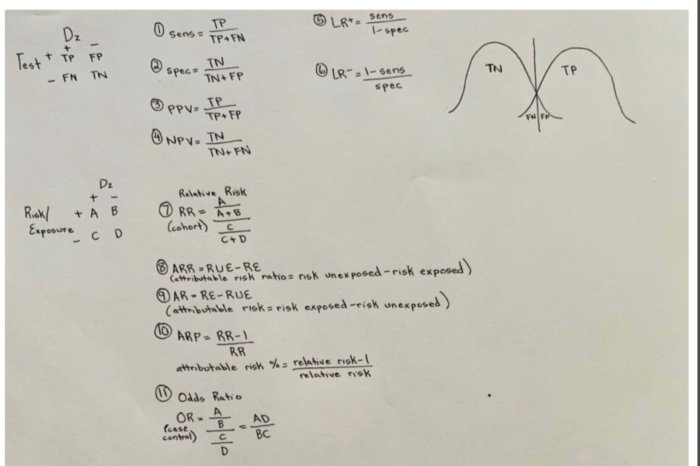
Medical research relies on various study designs to gather and analyze data, each with its own strengths and limitations. Understanding the principles of study design is crucial for interpreting research findings accurately.
Types of Study Designs
- Observational Studies:These studies observe individuals over time without actively intervening. They can be retrospective (looking back at past data) or prospective (following individuals over time). Examples include cohort studies and case-control studies.
- Randomized Controlled Trials (RCTs):RCTs are considered the gold standard for evaluating the effectiveness of interventions. They randomly assign participants to different treatment groups, ensuring unbiased comparison of outcomes.
- Meta-Analyses:Meta-analyses combine data from multiple studies to provide a more comprehensive analysis. They can increase statistical power and provide a broader perspective on research findings.
Data Collection, Analysis, and Interpretation, Step 1 biostats cheat sheet
Data collection methods vary depending on the study design. Observational studies often use surveys or medical records, while RCTs involve standardized data collection protocols. Data analysis involves statistical techniques to summarize, compare, and draw conclusions from the data. Interpretation of results should consider the study design, potential biases, and the overall context of the research question.
Data Presentation and Interpretation
Effective data presentation is crucial for conveying medical information clearly and accurately. Tables, graphs, and figures help organize and summarize data, making it easier to understand patterns and trends.
Interpreting statistical results involves drawing meaningful conclusions from medical data. It requires an understanding of statistical concepts and the ability to apply them to real-world scenarios. By interpreting results correctly, healthcare professionals can make informed decisions based on evidence.
Tables
- Tables present data in a structured format, with rows and columns. They are suitable for displaying small datasets or specific data points.
- When creating tables, ensure they are concise, clear, and easy to read. Use descriptive column headings and avoid unnecessary information.
Graphs
- Graphs visually represent data, making it easier to identify patterns and trends. Different types of graphs, such as bar graphs, line graphs, and scatterplots, are used for different purposes.
- When choosing a graph type, consider the type of data and the relationships you want to highlight. Ensure graphs are labeled clearly and have appropriate axes.
Figures
- Figures include images, charts, or diagrams that provide additional information or illustrate complex concepts.
- Figures should be relevant to the topic and complement the text. Use high-quality images and ensure they are properly labeled and cited.
Ethical Considerations in Biostatistics
The use of statistical methods in medical research and practice raises important ethical considerations that researchers and practitioners must be aware of.
One key ethical concern is data privacy. Statistical methods often involve collecting and analyzing sensitive personal information, such as medical records and genetic data. It is essential to protect the privacy of individuals by ensuring that their data is kept confidential and used only for authorized purposes.
Informed Consent
Informed consent is another important ethical consideration in biostatistics. Before participating in research studies, individuals must be fully informed about the purpose of the study, the potential risks and benefits, and their rights as participants. They must give their voluntary consent to participate in the study.
Bias and Misinterpretation
Statistical methods can be biased or misinterpreted, leading to inaccurate or misleading conclusions. It is important for researchers and practitioners to be aware of potential sources of bias and to take steps to minimize their impact. They must also be careful to interpret statistical results accurately and avoid making unwarranted claims.
FAQ
What is the significance of biostatistics in medical practice?
Biostatistics provides the foundation for understanding and interpreting medical data, enabling healthcare professionals to make informed decisions based on evidence.
How can I effectively apply inferential statistics in medical research?
Inferential statistics allow you to draw conclusions about a larger population based on a smaller sample. By understanding concepts like hypothesis testing and confidence intervals, you can make accurate inferences from your data.
What ethical considerations should I be aware of when using biostatistics?
Ethical considerations in biostatistics include data privacy, informed consent, and the potential for bias and misinterpretation. It’s crucial to ensure that statistical methods are used responsibly and with integrity.